If you are looking for a good open-source sFlow collector and don’t like the look of Nfsen or FlowViewer then you should consider trying Elasticsearch.
Bash Script
To get the data into Elasticsearch we take a low spec ubuntu server and install wireshark on it. Now create a bash script as per below. This script will run the command version of wireshark (tshark) and capture sFlow data being sent to the server.
tshark -i<(sflowtool -t) -T fields -n -E separator=, -E quote=d -e frame.number -e frame.time -e ip.src -e ip.dst -e _ws.col.Protocol -e frame.len -e tcp.srcport -e tcp.dstport -e udp.srcport -e udp.dstport -e _ws.col.Info
Logstash Config
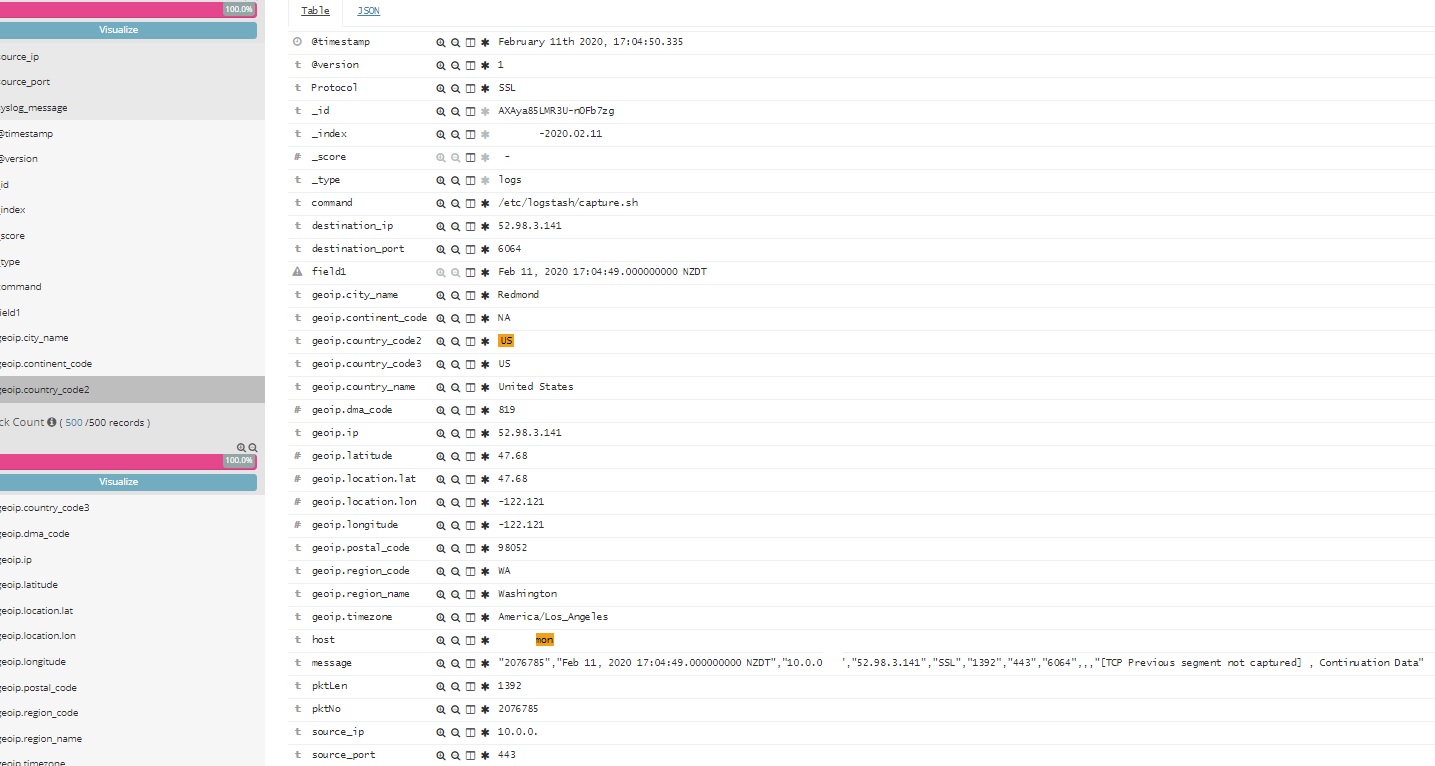
In the example below logstash is using the bash script as its input and splitting the data into the core fields source_ip, source_port, destination_ip, destination_port and pktLen, pktNo and protocol.
input {
  pipe {
    command => "/etc/logstash/capture.sh"
  }
}

filter {

  # Parse the date
  date {
    match => ["timestamp",
      "MMM dd HH:mm:ss",
      "MMM  d HH:mm:ss",
      "MMM dd yyyy HH:mm:ss",
      "MMM  d yyyy HH:mm:ss"
    ]
  }
}

filter{
   grok {
     match => ["message", "\"%{INT:pktNo}\",\"%{GREEDYDATA:field1}\",\"%{IP:source_ip}\",\"%{IP:destination_ip}\",\"%{WORD:Protocol}\",\"%{INT:pktLen}\",,,,,\"%{INT:source_port}\",\"%{INT:destination_port}\",\"%{GREEDYDATA:syslog_message}",
               "message", "\"%{INT:pktNo}\",\"%{GREEDYDATA:field1}\",\"%{IP:source_ip}\",\"%{IP:destination_ip}\",\"%{WORD:Protocol}\",\"%{INT:pktLen}\",\"%{INT:source_port}\",\"%{INT:destination_port}\",,,\"%{GREEDYDATA:syslog_message}",
               "message", "\"%{INT:pktNo}\",\"%{GREEDYDATA:field1}\",\"%{IP:source_ip}\",\"%{IP:destination_ip}\",\"%{WORD:Protocol}\",\"%{INT:pktLen}\",,,\"%{INT:source_port}\",\"%{INT:destination_port}\",\"%{GREEDYDATA:syslog_message}"

 ] }

    geoip {
      database => "/etc/logstash/GeoLite2-City.mmdb"
      source => "destination_ip"
    }

if "," in [source_ip] { drop{ } }
}

output {
  elasticsearch {
      hosts => ["http://xxx.xxx.xxx.xxx:9200"]
      user => "elastic"
      password => "changeme"
      action => "index"
      index => "indexname-%{+YYYY.MM.dd}"
  }
  stdout { codec => rubydebug }
}
It is also parsing the destination_ip field against a GEOIP database to gather the destination country to add to elasticsearch.

Once in elasticsearch you can decide how you want to visualize the data, whether with the inbuilt Kibana visualizations or an elasticsearch capable dashboard app such as Grafana. Personally I would recommend Grafana as you can add in data from other data sources to a single dashboard and configure email alerts such as source IP’s mapping drives to > X unique destination IP addresses.
Update 11/07/2020: Since publishing this post I have found a community based logstash codec which has proven to be reliable to importing sflow data into Elasticsearch. See this post for more info on how.


